Visualization Gallery
This gallery shows the visual output you can create with the Flamingo E-Scooter package. Use these examples to reproduce the maps and charts from your own analysis.
Path heatmap
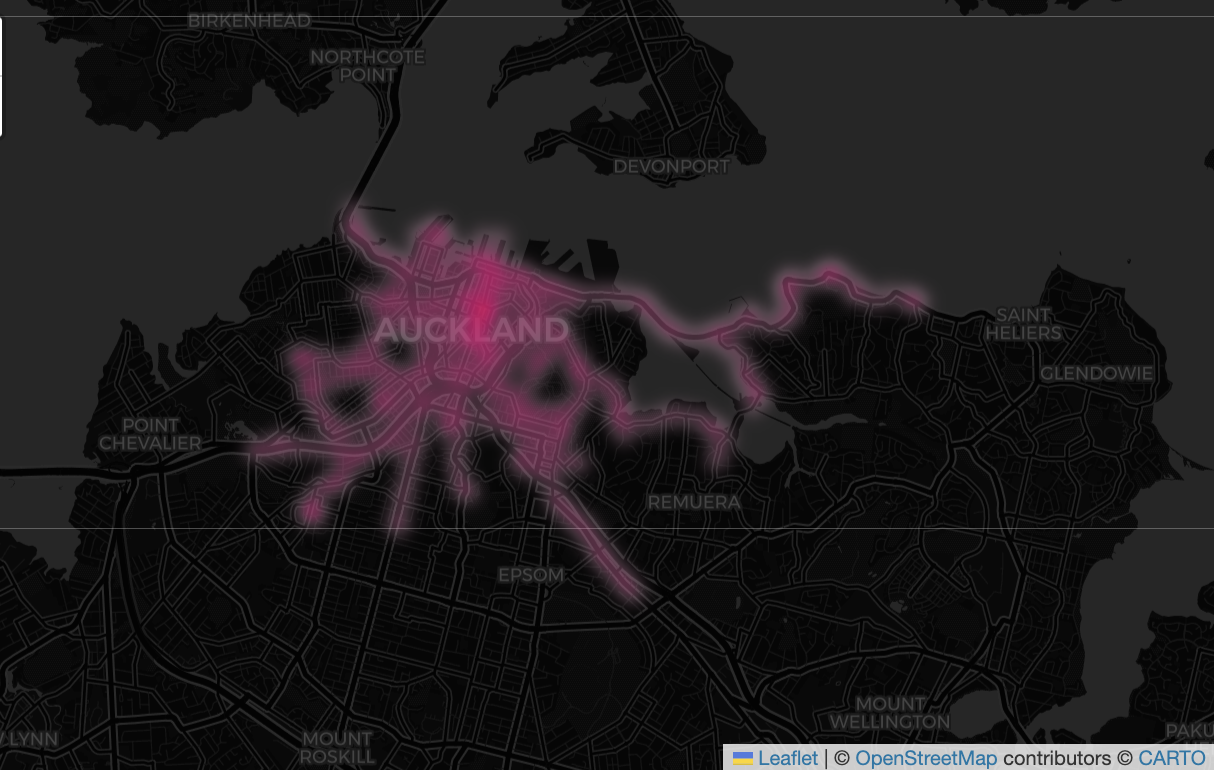
The path_heatmap() function renders an interactive route density map. It is useful for identifying high-volume corridors and common scooter travel routes across the Auckland CBD.
from flamingo_escooter import load_trips, path_heatmap

trips = load_trips()
map_obj = path_heatmap(trips)
map_obj.save('path_heatmap.html')
Violation heatmap
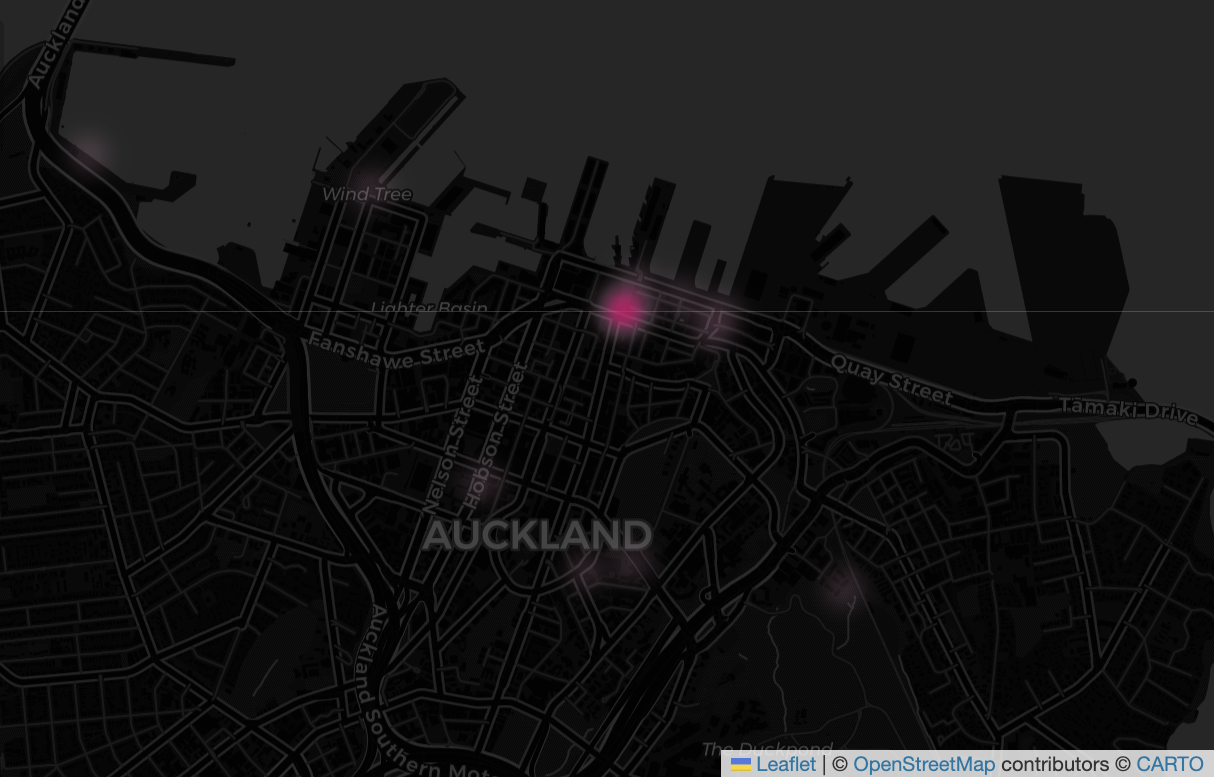
Use violation_heatmap(trips_gdf, location_type='end') to display where trips ended inside restricted geofence or no-parking zones.
from flamingo_escooter import load_trips, load_geofence, geofence_violations, violation_heatmap

trips = load_trips()
zones = load_geofence()
violations = geofence_violations(trips, zones)
map_obj = violation_heatmap(violations)
map_obj.save('violation_heatmap.html')
Transit proximity
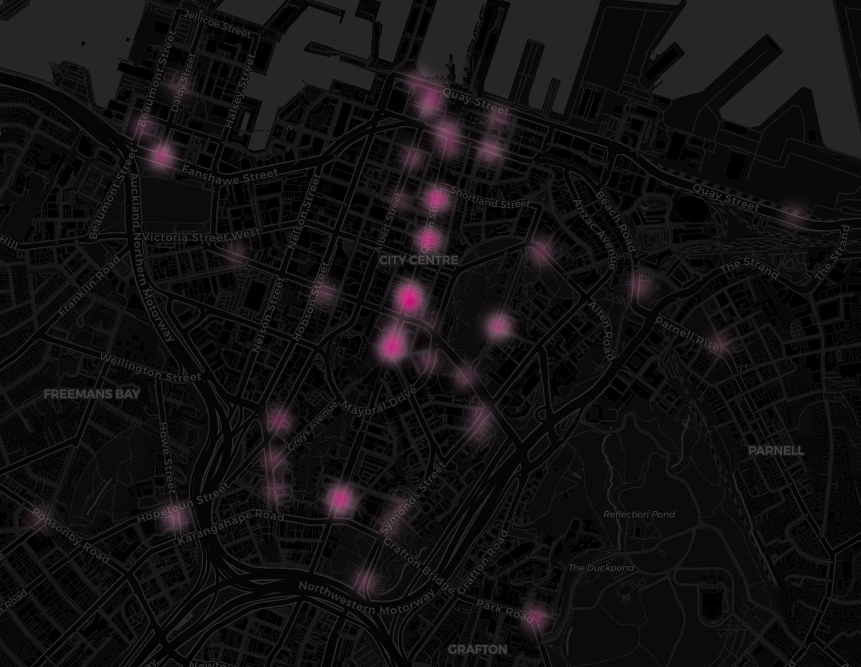
The first_and_last_mile_heatmap() visualizes trip endpoints near public transport stops, helping to reveal first/last-mile connectivity patterns.
from flamingo_escooter import load_trips, load_transit_stations, transit_proximity, first_and_last_mile_heatmap

trips = load_trips()
stops = load_transit_stations()
trips = transit_proximity(trips, stops, distance=20)
map_obj = first_and_last_mile_heatmap(trips, location_type='both')
map_obj.save('transit_heatmap.html')
Violation summary visuals
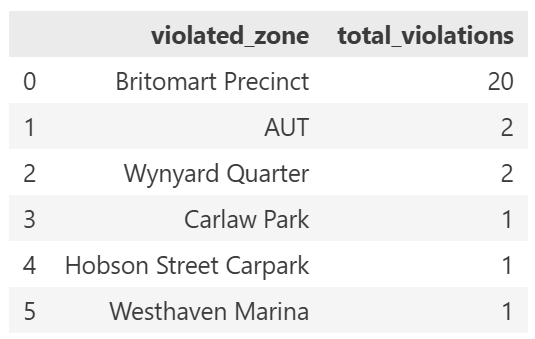
Use violations_table_wide(trips_gdf) to generate a zone-level table of violation counts and support management decisions.
Workflow tips
- Start with
path_heatmap()to explore route density. - Use
violation_heatmap()to focus on problem areas. - Use transit proximity analysis to evaluate network access and identify gaps in connections.
Reproducing the gallery
The package includes sample dataset and demo visuals. Re-run the examples above with your own data to generate customized maps for reports or presentations.